
Home / The Canadian Education Market
The Canadian Education Market
Good reasons to make Canada part of your international student recruitment strategy, in numbers.
Population growth since 2020, and 1% in the past year alone
One of the highest tertiary education participation rates in the world
For average wages, higher than the OECD average
Population
Canada’s population is growing quickly
Canada’s population has grown by 10% since 2020, adding 3.9m people to reach 41.9m in 2026.
Canada has grown 16.9% since 2014, compared to the USA at 5.8% and the United Kingdom at 7.1% over the same period.
Of the 13 provinces and territories, Ontario has the largest population, with 39% of the total. It is followed by Quebec (where both French and English are spoken), British Columbia, and Alberta.
people in 2026
since 2020
Population growth since 2014
Population by province and territory, Fall 2026
| Ontario | 16,302,662 | 39% |
| Quebec | 9,080,759 | 22% |
| British Columbia | 5,721,653 | 14% |
| Alberta | 5,126,739 | 12% |
| Manitoba | 1,522,489 | 4% |
| Saskatchewan | 1,283,796 | 3% |
| Nova Scotia | 1,105,521 | 3% |
| New Brunswick | 886,642 | 2% |
| Newfoundland and Labrador | 553,421 | 1% |
| Prince Edward Island | 183,069 | 0% |
| Yukon | 50,804 | 0% |
| Northwest Territories | 45,719 | 0% |
| Nunavut | 43,529 | 0% |
Education
Canadians value education
Canada ranks number one in the OECD, with 64% of 25–64 year-olds holding a tertiary education.
Share of 25–64 year-olds with a tertiary education (OECD)
Higher education
2.3 million students at the tertiary level
In 2024–25, according to Statistics Canada. The fastest growing segments over the past 5 years were short-cycle tertiary education at 23% (that is, diplomas, certificates, and CEGEP technical programs), followed by post-secondary non-tertiary education at 12% (that is, vocational or occupational programs, upgrading and pathway programs, and prep programs that lead to tertiary education).
Short-cycle tertiary education
Post-secondary non-tertiary education
Master's
Bachelor's
Doctoral
Upper secondary education
Students by level in 2024/25, and change since 2020/21. Total: 2,345,775 students, +8%.
| Total International Standard Classification of Education (ISCED) | 2,345,775 | 8% |
| Upper secondary education | 22,584 | 1% |
| Post-secondary non-tertiary education | 259,791 | 12% |
| Short-cycle tertiary education | 512,589 | 23% |
| Bachelor's or equivalent | 1,135,782 | 3% |
| Master's or equivalent | 235,287 | 7% |
| Doctoral or equivalent | 59,901 | 2% |
| Not in International Standard Classification of Education (ISCED) | 119,838 | 0% |
How the education system works
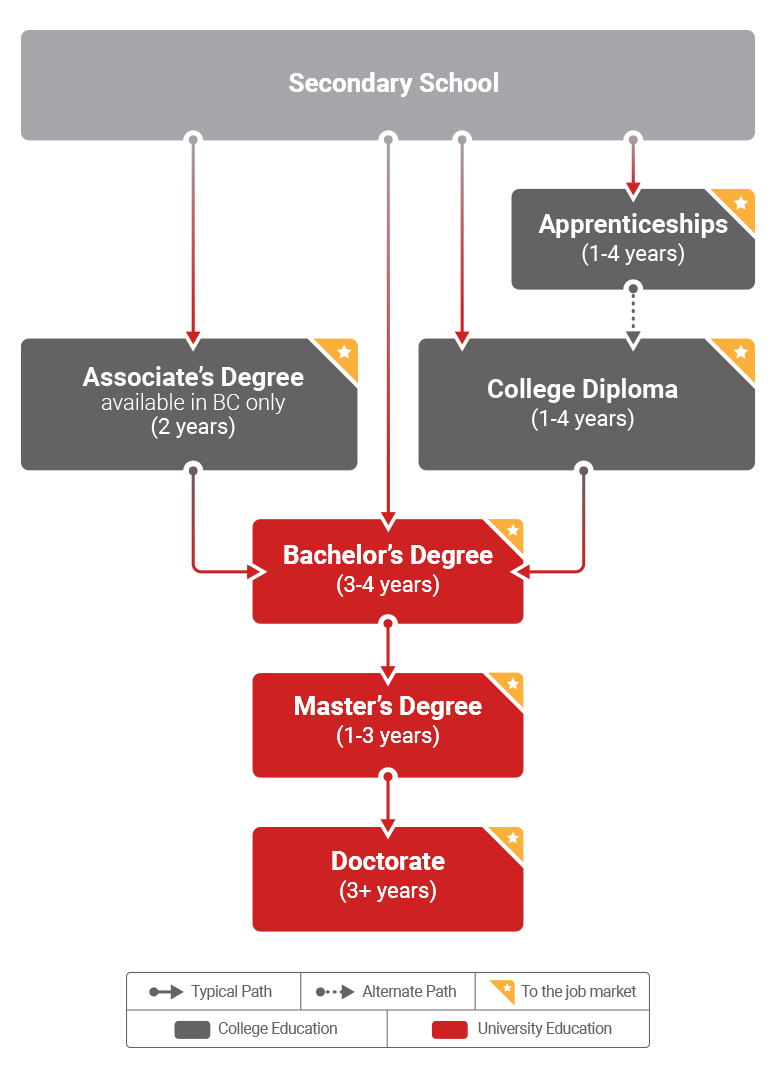
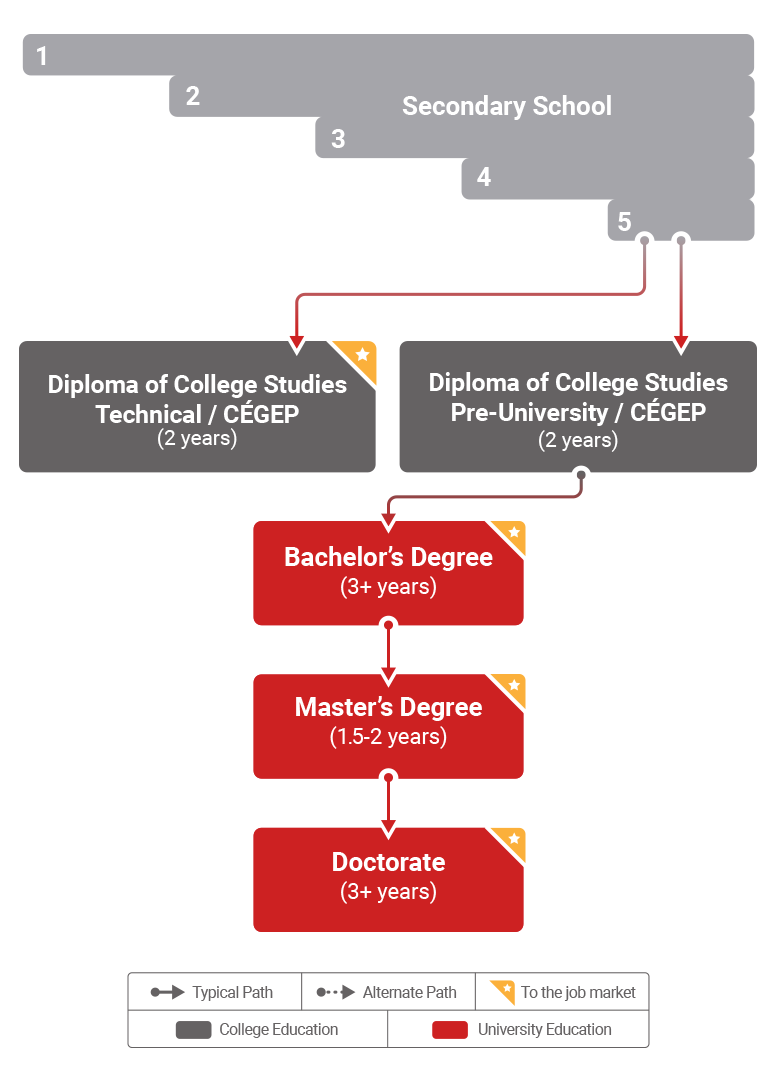
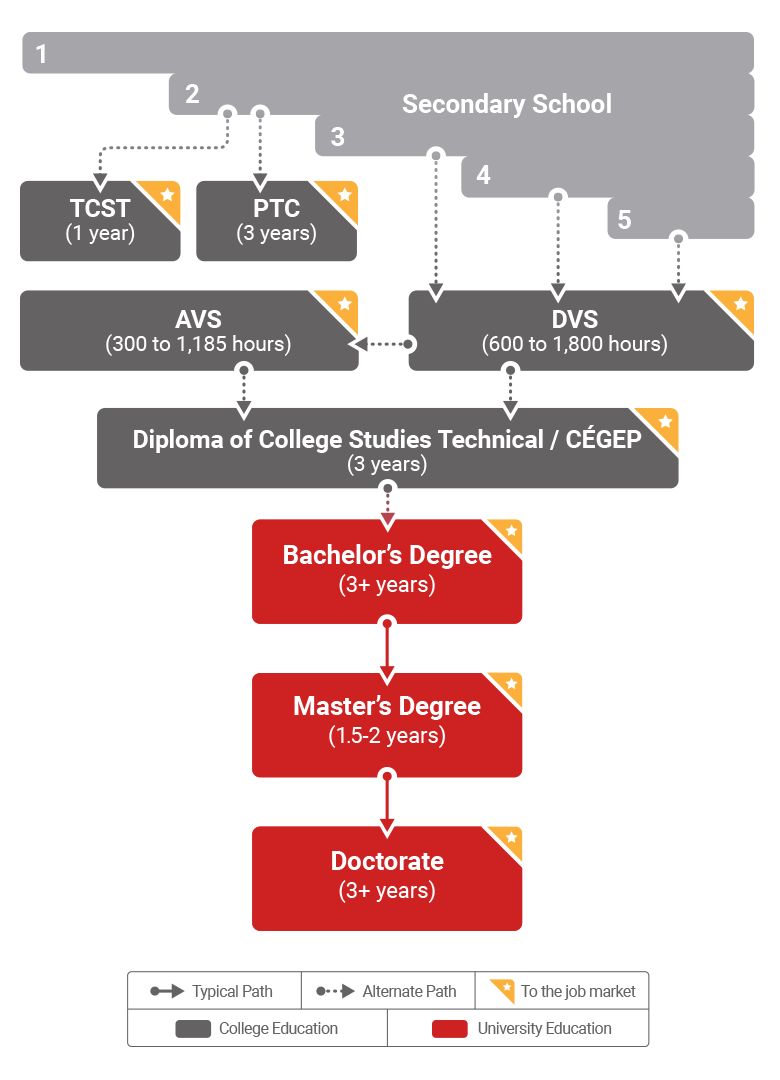
Colleges predominantly offer 2 to 3-year diploma programs, though many are beginning to offer 4-year degree programs as well. Universities predominantly offer Bachelor, Master’s, and Doctoral programs. Read the Canadian education system explainer.
Fields of study
Where Canadian students are enrolling
Across all levels of tertiary education, the fastest growing programs since 2011 are in computer science, healthcare, mathematics, and engineering. The largest by enrolment are business, healthcare, and the liberal arts and humanities.
Largest fields by enrolment, 2024/25
Computer and information sciences since 2011
Health professions residencies since 2011
Mathematics and statistics since 2011
Engineering since 2011
| Agricultural and veterinary sciences/services/operations and related fields | 19,068 | -1.2% | 29.5% |
| Architecture and related services | 17,850 | 6.8% | 22.8% |
| Area, ethnic, cultural, gender, and group studies | 10,146 | 10.8% | 45.1% |
| Basic skills and general exam preparation (not for credit) | 14,856 | 30.4% | -17.8% |
| Biological and biomedical sciences | 92,694 | 6.9% | 44.4% |
| Business, management, marketing and related support services | 418,185 | 7.2% | 35.0% |
| Communication, journalism and related programs | 28,974 | 0.2% | -5.8% |
| Communications technologies/technicians and support services | 10,218 | 8.4% | 25.7% |
| Computer and information sciences and support services | 136,680 | 18.2% | 271.3% |
| Construction trades | 10,503 | 20.8% | 26.9% |
| Culinary, entertainment, and personal services | 12,249 | 12.1% | 37.9% |
| Education | 105,774 | 5.0% | -0.2% |
| Engineering | 143,286 | 3.2% | 56.8% |
| Engineering/engineering-related technologies/technicians | 61,578 | 1.7% | 22.1% |
| English language and literature/letters | 17,553 | 10.5% | -19.4% |
| Family and consumer sciences/human sciences | 57,228 | 19.8% | 52.1% |
| French language and literature/letters (CAN) | 4,083 | -7.4% | -40.7% |
| Health professions and related programs | 243,663 | 10.7% | 31.7% |
| Health professions residency/fellowship programs | 975 | 16.5% | 246.0% |
| Health-related knowledge and skills (not for credit) | 1,896 | 17.5% | 55.1% |
| High school/secondary diploma and certificate programs | 39,744 | 31.3% | -0.2% |
| History | 12,678 | -0.1% | -32.0% |
| Indigenous and foreign languages, literatures, and linguistics | 13,305 | -3.3% | -37.2% |
| Legal professions and studies | 33,534 | 7.9% | 20.9% |
| Leisure and recreational activities and non-commercial vehicle operation (not for credit) | 1,893 | -17.5% | -24.1% |
| Liberal arts and sciences, general studies and humanities | 171,927 | -0.4% | -29.3% |
| Library science | 3,300 | 27.9% | 1.0% |
| Mathematics and statistics | 19,761 | -0.9% | 71.5% |
| Mechanic and repair technologies/technicians | 13,023 | 7.8% | -4.1% |
| Medical residency/fellowship programs | 12,705 | -8.6% | -8.6% |
| Military science, leadership and operational art | 66 | -63.9% | 57.2% |
| Multidisciplinary/interdisciplinary studies | 112,218 | 6.5% | 42.7% |
| Natural resources and conservation | 19,878 | -2.4% | 17.2% |
| Parks, recreation, leisure, fitness, and kinesiology | 41,250 | -0.6% | 19.3% |
| Personal awareness and self-improvement (not for credit) | 39 | -18.8% | -95.9% |
| Philosophy and religious studies | 8,430 | 2.7% | -16.8% |
| Physical sciences | 24,678 | -5.0% | 4.5% |
| Pre-technology education/pre-industrial arts programs (CAN) | 1,032 | 9.6% | 26.0% |
| Precision production | 5,853 | 28.0% | 30.6% |
| Psychology | 76,212 | 4.3% | 49.2% |
| Public administration and social service professions | 44,787 | 9.3% | 19.1% |
| Science technologies/technicians | 4,464 | -3.0% | 40.7% |
| Security and protective services | 33,141 | 3.8% | 7.9% |
| Social sciences | 96,957 | -1.4% | 2.5% |
| Theology and religious vocations | 2,535 | -6.8% | -18.0% |
| Total, field of study | 2,345,775 | 6.1% | 19.9% |
| Transportation and materials moving | 4,524 | 16.4% | 54.9% |
| Visual and performing arts | 75,261 | 2.6% | -0.4% |
Master’s level
Computing, healthcare and multidisciplinary programs lead growth
At the Master’s level, computer sciences, healthcare residencies, and multidisciplinary programs are growing fastest.
Computer and information sciences since 2011
Health professions residencies since 2011
Multidisciplinary programs since 2011
Engineering since 2011
| Agricultural and veterinary sciences/services/operations and related fields | 3,255 | 1% | 12% |
| Architecture and related services | 3,027 | 0% | 8% |
| Area, ethnic, cultural, gender, and group studies | 1,047 | -4% | 5% |
| Basic skills and general exam preparation (not for credit) | 15 | 67% | – |
| Biological and biomedical sciences | 7,485 | 0% | 15% |
| Business, management, marketing and related support services | 35,136 | 1% | 31% |
| Citizenship activities (not for credit) | – | – | – |
| Communication, journalism and related programs | 2,007 | 1% | 5% |
| Communications technologies/technicians and support services | 36 | -14% | -29% |
| Computer and information sciences and support services | 10,506 | -1% | 186% |
| Construction trades | 12 | 0% | – |
| Culinary, entertainment, and personal services | 18 | 0% | – |
| Education | 22,359 | 1% | 21% |
| Engineering | 23,118 | -9% | 69% |
| Engineering/engineering-related technologies/technicians | 168 | -8% | -2% |
| English language and literature/letters | 900 | 8% | -18% |
| Family and consumer sciences/human sciences | 714 | -14% | 0% |
| French language and literature/letters (CAN) | 597 | -7% | -24% |
| Health professions and related programs | 44,967 | 5% | 61% |
| Health professions residency/fellowship programs | 717 | -11% | 181% |
| Health-related knowledge and skills (not for credit) | – | – | – |
| High school/secondary diploma and certificate programs | – | – | – |
| History | 936 | 3% | -23% |
| Indigenous and foreign languages, literatures, and linguistics | 984 | 5% | -7% |
| Interpersonal and social skills (not for credit) | – | – | – |
| Legal professions and studies | 18,318 | 3% | 28% |
| Leisure and recreational activities and non-commercial vehicle operation (not for credit) | 3 | – | – |
| Liberal arts and sciences, general studies and humanities | 342 | -35% | -32% |
| Library science | 714 | 4% | -42% |
| Mathematics and statistics | 1,440 | 3% | 14% |
| Mechanic and repair technologies/technicians | – | – | – |
| Medical residency/fellowship programs | 12,597 | -10% | -14% |
| Military science, leadership and operational art | 27 | 13% | 13% |
| Military technologies and applied sciences | – | – | – |
| Multidisciplinary/interdisciplinary studies | 6,792 | 11% | 130% |
| Natural resources and conservation | 3,309 | 2% | 10% |
| Parks, recreation, leisure, fitness, and kinesiology | 1,917 | 4% | 30% |
| Personal awareness and self-improvement (not for credit) | – | – | – |
| Philosophy and religious studies | 909 | -4% | -21% |
| Physical sciences | 2,952 | -4% | -5% |
| Pre-technology education/pre-industrial arts programs (CAN) | – | – | – |
| Precision production | – | – | – |
| Psychology | 4,182 | 2% | 24% |
| Public administration and social service professions | 8,115 | 0% | 15% |
| Science technologies/technicians | 12 | 33% | – |
| Security and protective services | 651 | -6% | 64% |
| Social sciences | 7,212 | -2% | 3% |
| Theology and religious vocations | 792 | -1% | -11% |
| Transportation and materials moving | 6 | -50% | – |
| Visual and performing arts | 3,318 | -1% | -5% |
Student mobility
Canadians study abroad
of Canadian undergraduate students take part in a study abroad experience
Canadians studied in the United States in 2024–25, making Canada the 4th largest sender after India, China, and South Korea
Canadians studied in the United Kingdom in 2024–25
Other top countries of interest (CBIE, 2023)
The most popular areas of interest for Canadians who study abroad: business, social sciences, humanities, health sciences and natural sciences.
Our student database
300K students interested in studying internationally
That’s from a database of over 1.4 million students, and we add more destinations every year. The top destinations remain consistent: the United States first, followed by the United Kingdom, Australia, Germany, and France.
One-month snapshot of signups, summer 2024 vs. summer 2025.
Top destinations outside Canada · % of signups
| 1 | Canada | 1% | 89% |
| 2 | United States | 21% | 25% |
| 3 | United Kingdom | 1% | 13% |
| 4 | Australia | 3% | 10% |
| 5 | Germany | 9% | 10% |
| 6 | France | 5% | 10% |
| 7 | Italy | 7% | 10% |
| 8 | Ireland | 9% | 9% |
| 9 | Switzerland | 5% | 9% |
| 10 | Spain | 7% | 9% |
| 11 | Japan | 12% | 9% |
| 12 | New Zealand | 2% | 9% |
| 13 | Netherlands | 5% | 9% |
| 14 | Sweden | 2% | 9% |
| 15 | Belgium | 6% | 8% |
| 16 | Norway* | 0% | 8% |
| 17 | Finland* | 0% | 8% |
| 18 | Greece | 8% | 8% |
| 19 | Denmark* | 0% | 8% |
| 20 | China | 11% | 8% |
| 21 | Singapore | 9% | 8% |
| 22 | Korea, Republic of | 6% | 8% |
| 23 | United Arab Emirates | 12% | 8% |
| 24 | Portugal | 7% | 8% |
| 25 | Austria | 8% | 8% |
| 26 | Poland | 5% | 8% |
| 27 | Hong Kong | 9% | 8% |
| 28 | Luxembourg | 7% | 8% |
| 29 | Saudi Arabia | 9% | 8% |
| 30 | Turkiye* | 0% | 8% |
| 31 | Mexico | 10% | 8% |
| 32 | Hungary | 8% | 8% |
| 33 | Puerto Rico* | 0% | 8% |
| 34 | Costa Rica | 6% | 8% |
| 35 | Romania* | 0% | 8% |
| 36 | Peru* | 0% | 8% |
| 37 | Russia* | 0% | 8% |
| 38 | Fiji | 9% | 8% |
| 39 | Thailand | 8% | 8% |
| 40 | Czech Republic | 9% | 8% |
| 41 | Malaysia | 8% | 8% |
| 42 | Philippines* | 0% | 8% |
| 43 | Argentina* | 0% | 7% |
| 44 | Georgia* | 0% | 7% |
| 45 | Taiwan, Province of China* | 0% | 7% |
| 46 | Malta* | 0% | 7% |
| 47 | South Africa* | 0% | 7% |
| 48 | Chile* | 0% | 7% |
| 49 | Barbados | 7% | 7% |
| 50 | Cyprus | 6% | 7% |
| 51 | Guatemala | 8% | 7% |
| 52 | Saint Vincent and the Grenadines | 7% | 7% |
| 53 | Saint Lucia | 7% | 7% |
| 54 | Estonia* | 0% | 7% |
| 55 | Jamaica | 41% | 7% |
| 56 | Dominica | 8% | 7% |
| 57 | Saint Kitts and Nevis | 7% | 7% |
| 58 | Grenada | 7% | 7% |
| 59 | Cayman Islands | 6% | 7% |
| 60 | Liechtenstein | 8% | 7% |
| 61 | Sri Lanka* | 0% | 7% |
| 62 | Tunisia* | 0% | 7% |
| 63 | Israel | 8% | 7% |
| 64 | Lebanon* | 0% | 7% |
| 65 | Kazakhstan | 9% | 7% |
| 66 | Nicaragua | 9% | 7% |
| 67 | Aruba | 8% | 7% |
| 68 | Ecuador* | 0% | 7% |
| 69 | Belize* | 0% | 7% |
| 70 | Iran, Islamic Republic of* | 0% | 7% |
| 71 | Antigua and Barbuda | 7% | 7% |
| 72 | Bangladesh* | 0% | 7% |
| 73 | Anguilla | 7% | 7% |
| 74 | Yemen* | 0% | 7% |
| 75 | India^ | 0% | 2% |
| 76 | Croatia^ | 0% | 2% |
* Added to the platform on or after June 2024. ^ Added to the platform in 2025.